Ureteral stone size measurements in non-enhanced CT (NECT) – interreader variability and prediction of spontaneous stone passage in different window settings
Ureteral stone size measurements in non-enhanced CT (NECT) – interreader variability and prediction of spontaneous stone passage in different window settings
Klara Sahlén (1), Marcin Popiolek (2), Anders Magnusson (1), Ulf Nyman(3), Johan Jendeberg(4) 1.Department of Surgical Sciences, Division of Radiology, Uppsala University Hospital, Uppsala, Sweden, 2. Department of Urology, Örebro University Hospital, Örebro, Sweden, 3.Department of Translational Medicine, Division of Medical Radiology, Lund University, Malmö, Sweden, 4.Department of Radiology, Faculty of Medicine and Health, Örebro University Hospital, Örebro, Sweden
To compare interreader variability in different window settings to suggest a common strategy for ureteral stone measurements in NECT. A second aim was to investigate the prediction of spontaneous stone passage in the four window settings and introducing the half-value window settings.
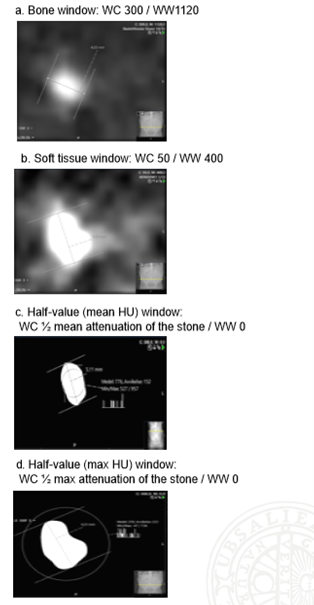
124 proximal ureteral stones detected at an acute NECT were retrospectively included. The study population was extracted from a previous study by Jendeberg et al. (1) Five observers measured each stone in three 3-mm reconstruction planes (axial, coronal, sagittal). The largest measurement obtained was used in the statistical analyses. Every stone was measured in four window settings also described in Figure 1: • Bone window: WC: 300 / WW:1120 • Soft tissue window: WC: 50 / WW:400 • Half-value window (mean): WC: ½ mean attenuation of the stone / WW 0. • Half-value window (max): WC: ½ max attenuation of the stone / WW 0 Attenuation of the stone was defined by a region of interest (ROI). The mean attenuation value of the stone was obtained by placing the limits of the ROI within the stone to avoid including background attenuation in the measurement. The maximum attenuation was found by including the entire stone within the ROI. The theory behind the half-value window has been presented in a Swedish national paper for radiologists, Imago Medica in 2021, by the Swedish uroradiology association “SURF” (Svensk uroradiologisk förening) (2) and the theory is illustrated in Figure 2. Logistic regression was used to evaluate the ability of stone size to predict spontaneous stone passage. 1. Jendeberg J, Geijer H, Alshamari M, Cierzniak B, Lidén M. Size matters: The width and location of a ureteral stone accurately predict the chance of spontaneous passage. Eur Radiol 2017;27:4775-4785. 2. Svensk uroradiologisk förening (2021). Mätning av urinvägskonkrement - SURF:s rekommendationer. Imago Medica (No 2), pp.12–19. Available at: www.sfmr.se/sidor/imago-medica (Accessed: 2 sept 2023)
Figure 1. Window settings. In c) The ROI is placed within the limits of the stone to avoid background attenuation to interfere with the mean value. In d) the ROI is instead placed to include the entire stone to obtain the maximum attenuation value.
Figure 2. Theory behind the Half-value window settings - Assuming that an object (blue circle) has a homogenous attenuation of 1000 HU and the background is 0 HU, an attenuation curve for that object would look like the blue line. However, a computer will produce an attenuation curve like the one shown in green. Mathematically these curves intersect at half the attenuation value between the object and the background. If the window width is set to 0 and the window level to the half-value, the CT-image will be as close as possible to the true size of the object, without any greyscale. As illustrated in the figure, measurement in the bone window (WC: 300-400, WW: 1000-2000) (upper green field) will underestimate the size of the object and measurements in the soft-tissue window (WC: 40-50, WW: 350-400) (lower green field) would overestimate its size due to blooming artefacts.
There was a larger interreader variability in the bone window (+/- 2.7 mm) compared to the other window settings, of which the smallest interreader variability was found in the half-value window based on the maximum attenuation of the stone (+/-0.2 mm). These results are presented in Bland-Altman plots in Figure 3. The limits of agreement and area under the ROC-curve for prediction of spontaneous stone passage are presented in Table 1. Probability of spontaneous stone passage related to stone size and interreader variability in different window settings is presented in Figure 4.
Figure 3. Bland-Altman plots showing limits of agreement between observers in different window settings - The interreader variability is largest in the bone window and smallest in the half-value window (based on the maximum attenuation of the stone).
Table 1. Interreader variability - Limits of agreement and area under the ROC-curve
Figure 4. Prediction of spontaneous stone passage in different window settings - Each observer is represented by a colored line in the graphs. The interreader variability was largest in the bone window and smallest in the half-value (max HU) window.
The half-value (max HU) window setting could be considered a standard window setting when a small interreader variability is of interest. The clinical relevance of an interreader variability of +/- 0.4 mm or less can be debated and the discriminative ability to predict spontaneous stone passage as high in each window setting.